Downloading your historical data from MoneyWorks
Getting started with new systems is always tricky, we know! This is why we have created this quick guide on preparing your historical data. Please set aside 10-15 minutes to get through it. And remember – this only has to be done once – participating in KPI Works in subsequent months takes mere minutes.
By uploading this historical data into your KPI Works dashboard, you’ll be able to see the trends that have been taking place within your organisation – and within your wider industry – right away. Also, some KPIs that we show you (e.g. insurance spend as a % of revenue) can only be calculated on an annualised basis – which is the second reason we ask for this historical data upfront.
Let’s get started!
Foreword: MoneyWorks does not have the capability to export the Balance Sheet into a 12-month format. This means that – if you want to benchmark using your Balance Sheet also, you’ll need to follow this tutorial on how to download your P&L and Balance Sheet one month at at time (and simply repeat it to get 12 months of your historical data this way). Please keep reading if you’re benchmarking using your Profit and Loss only.
Skip to:
Historical Profit and Loss
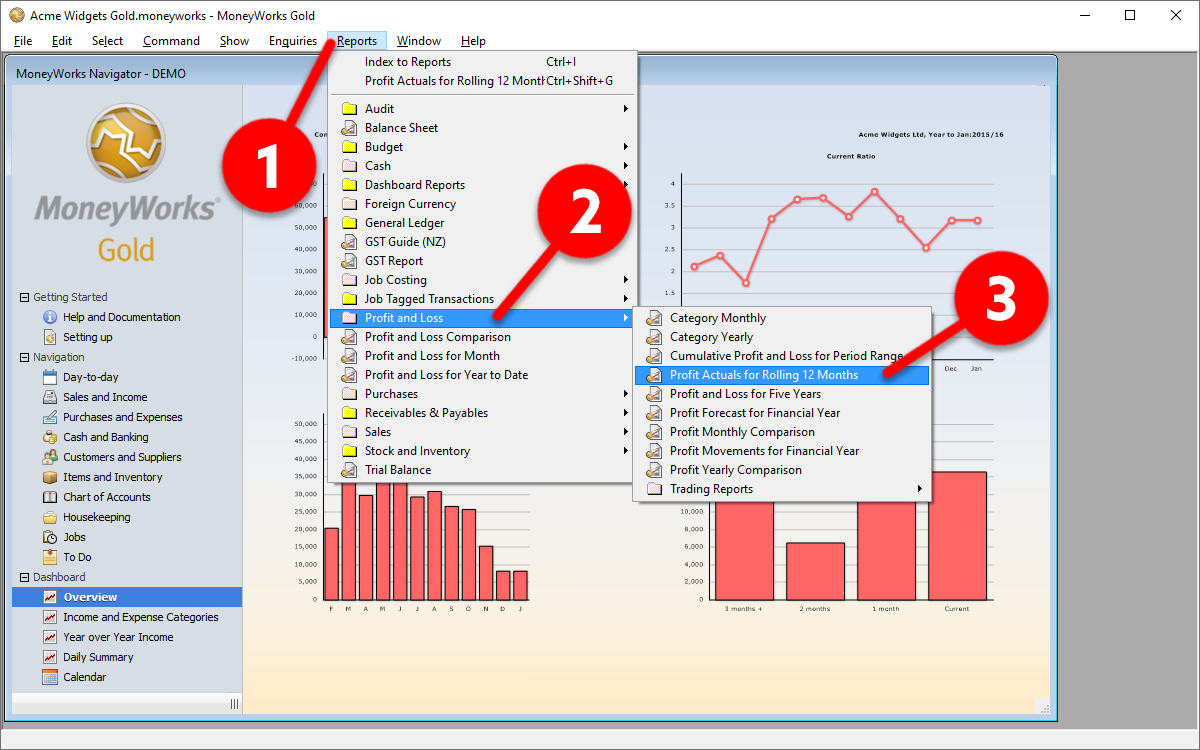
Once you’ve launched MoneyWorks, click on the Reports tab (1), expand the Profit and Loss folder (2) and select the Profit Actuals for Rolling 12 Months report (3)
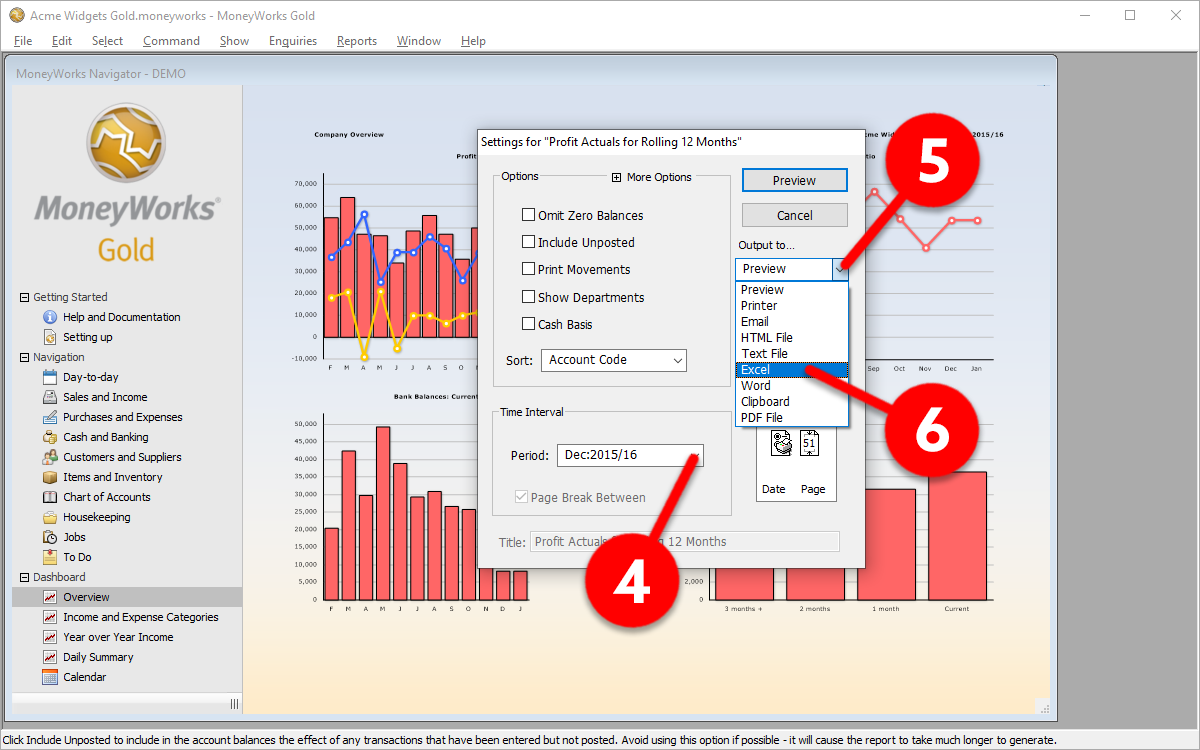
Select the correct year in Period (4), and in the Output to… window (5) select Excel (6)
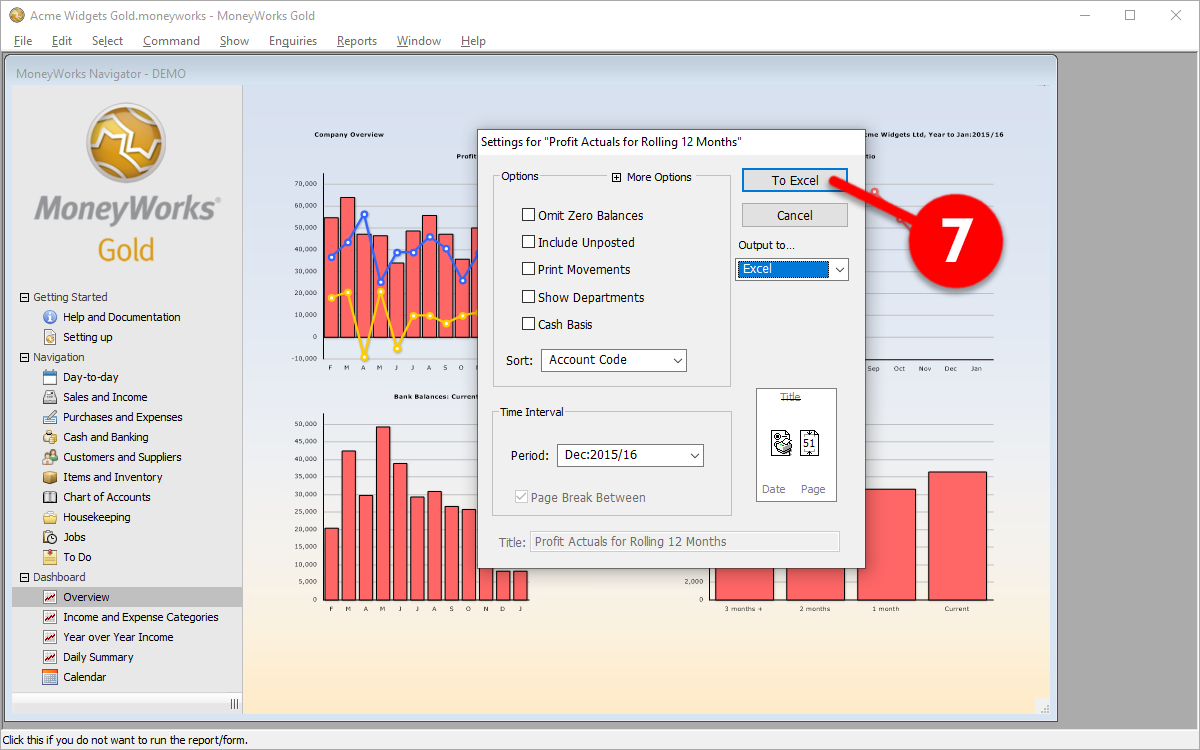
Next, click on the To Excel button (7)
Excel should automatically open a spreadsheet that looks like the below screenshot (8)
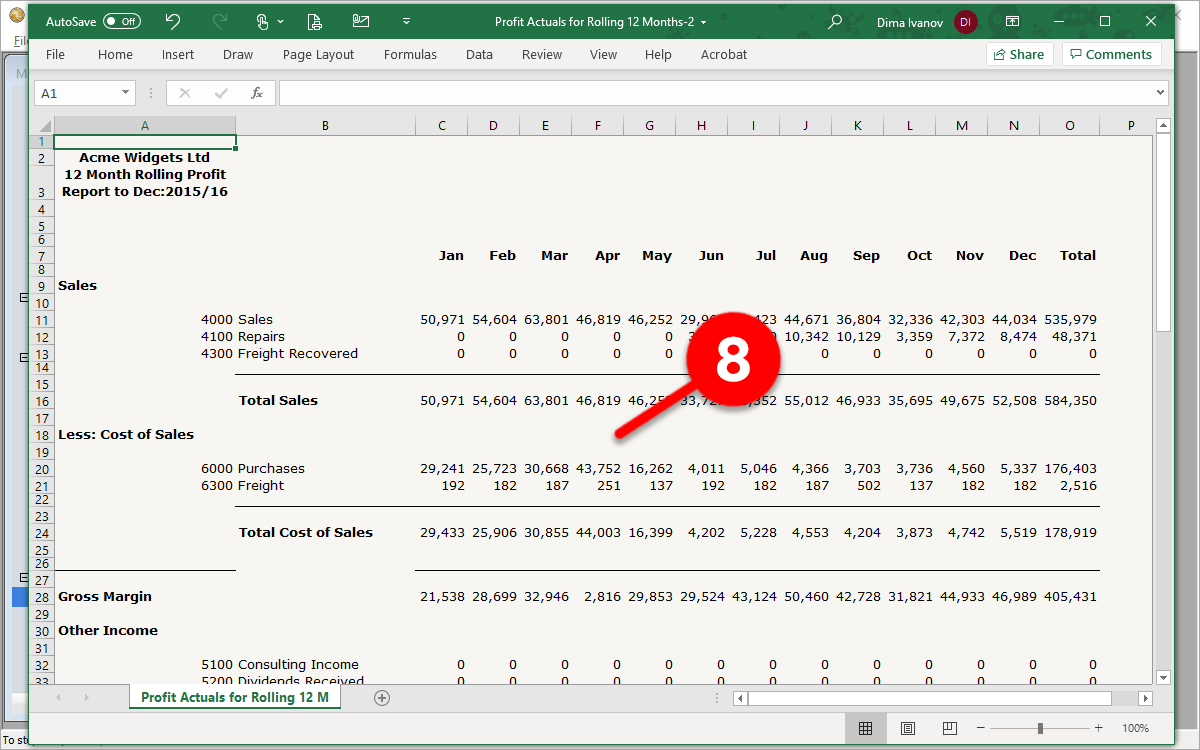
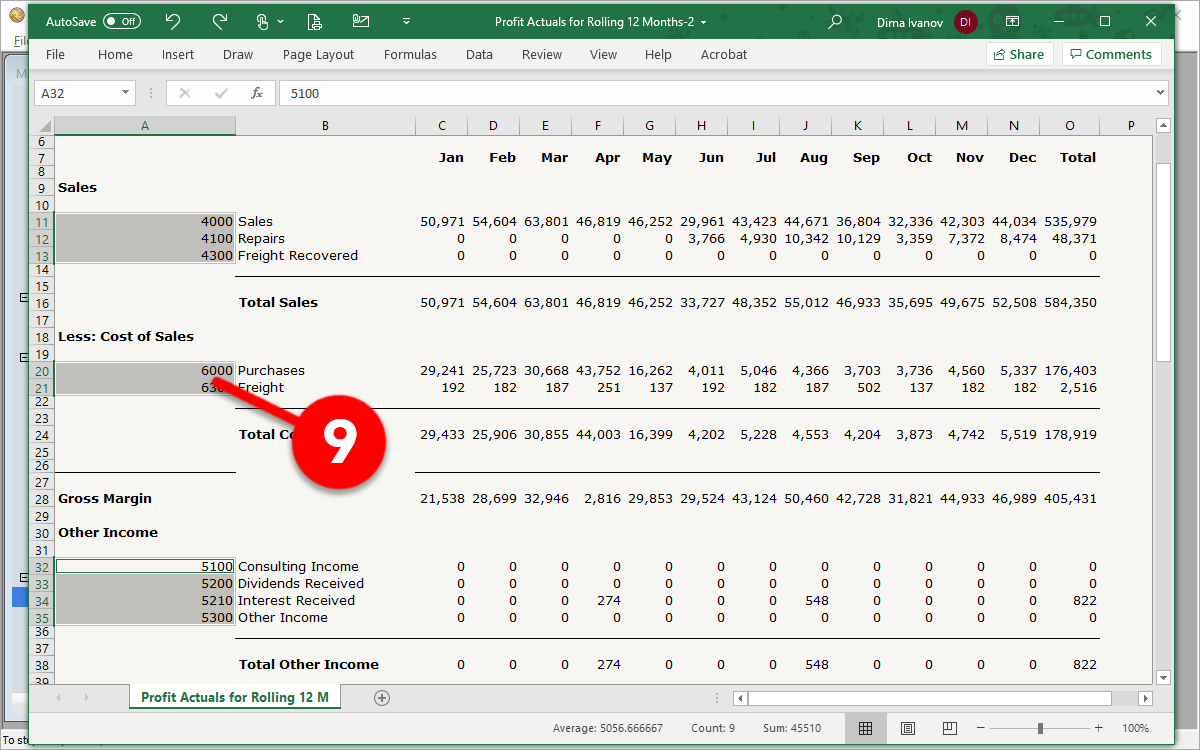
You will note that – in column A – MoneyWorks exports accounts codes (e.g. 4000, 4100, 4300, etc) in-between the headers (e.g. Sales, Less: Cost of Sales, etc) of your profit and loss (8) – please delete all such account codes from column A.
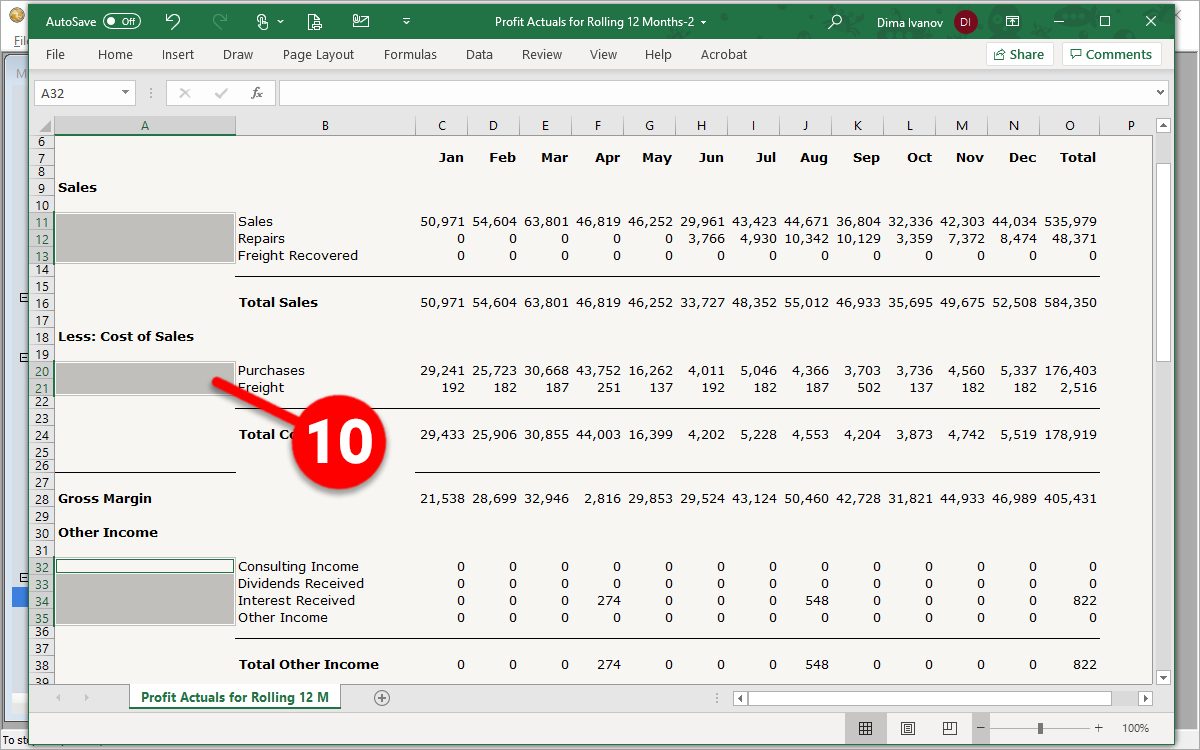
Once the account codes are deleted, your column A will only contain the header names, as per the screenshot below (10). Finally, please save the file on your computer, giving it a name that explains what file this is (e.g. P&L Jan19-Dec19)
Feel free to click here to download a sample file to see if yours looks similar.
Historical invoice count
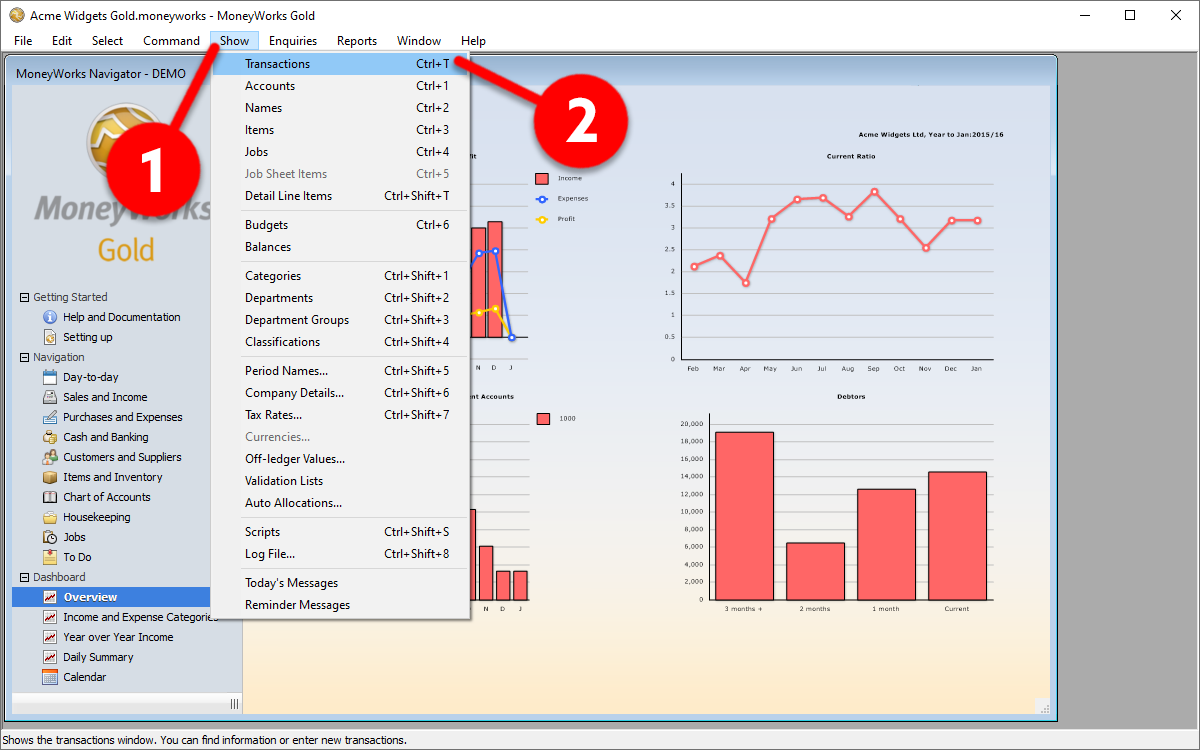
Once you’ve launched MoneyWorks, click on the Show tab on the top menu (1), and click on the Transactions button (2)
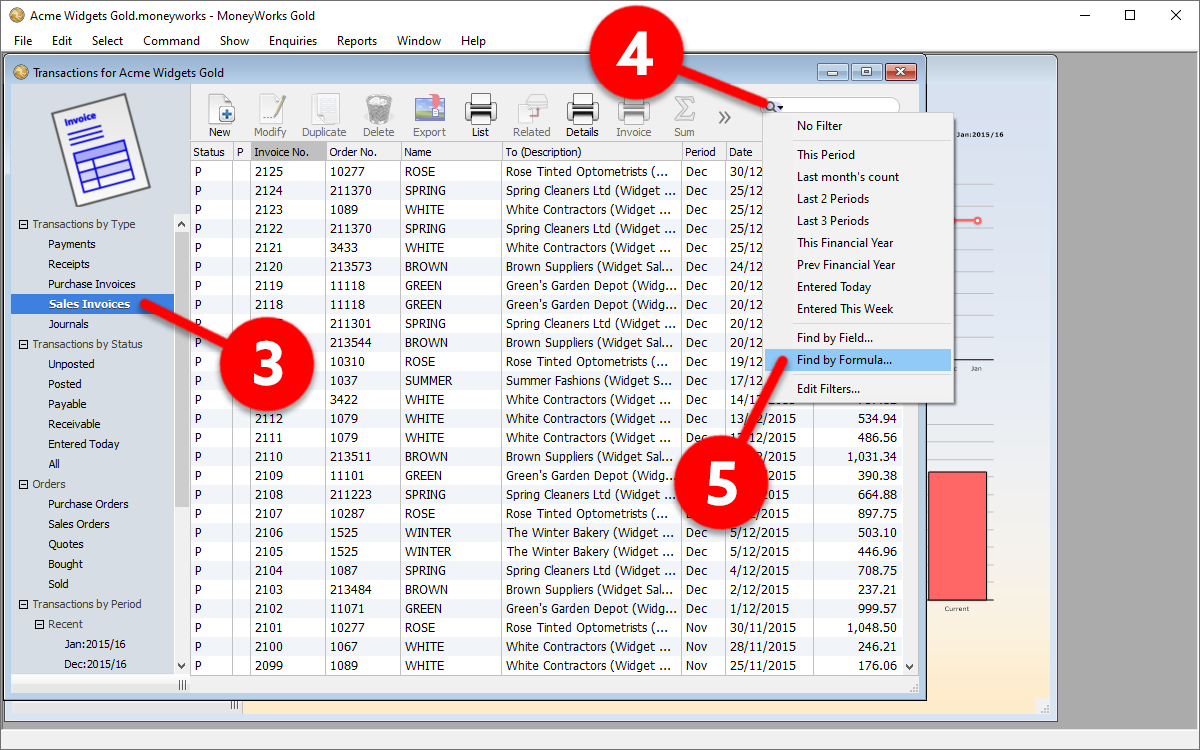
In the Transactions by Type section, click on Sales Invoices (3). Next, in the search window, click on the magnifying glass (4), and then select the Find by Formula… option (5)
Once the Advanced Find window comes up, copy-and-paste the following code into the Calculation window (6) to see the invoice count for the immediate past month (the “-1” bit of the code):
Period = NumToPeriod(PeriodToNum(CurrentPeriod()) – 1)
Once you’ve done this, click Find (7)
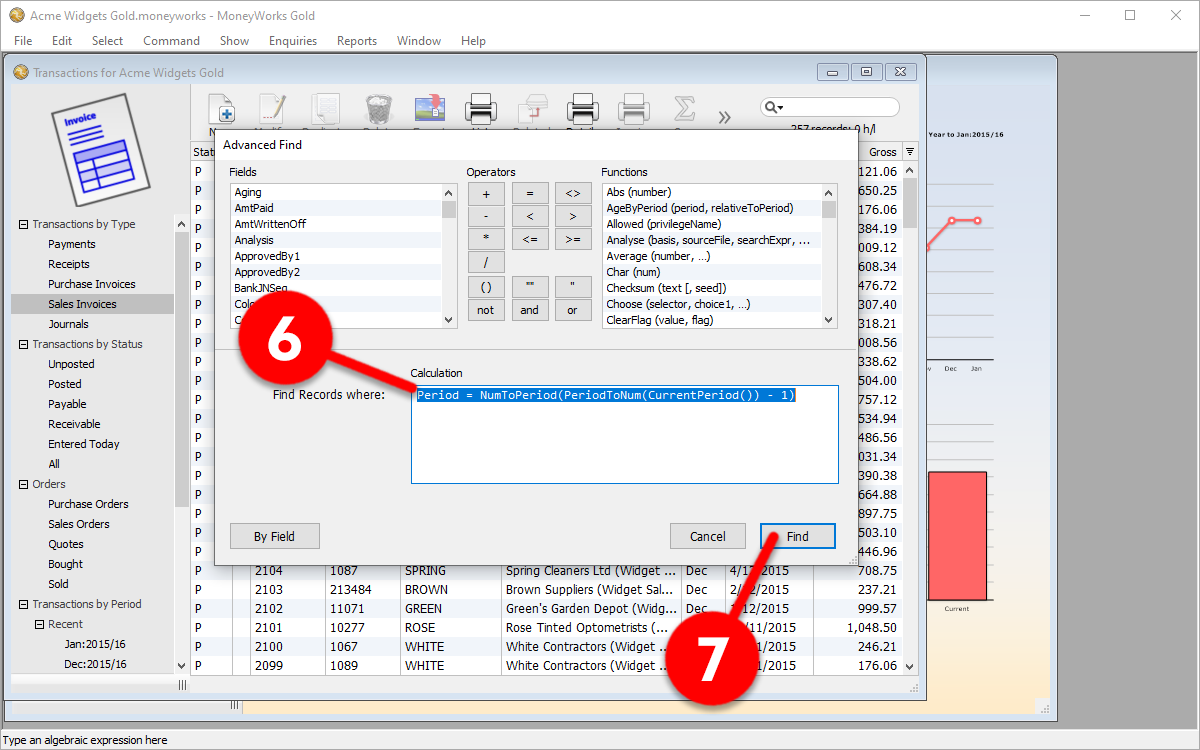
The invoice count will be displayed below the search window (8) – in this case, “24 invoices“:
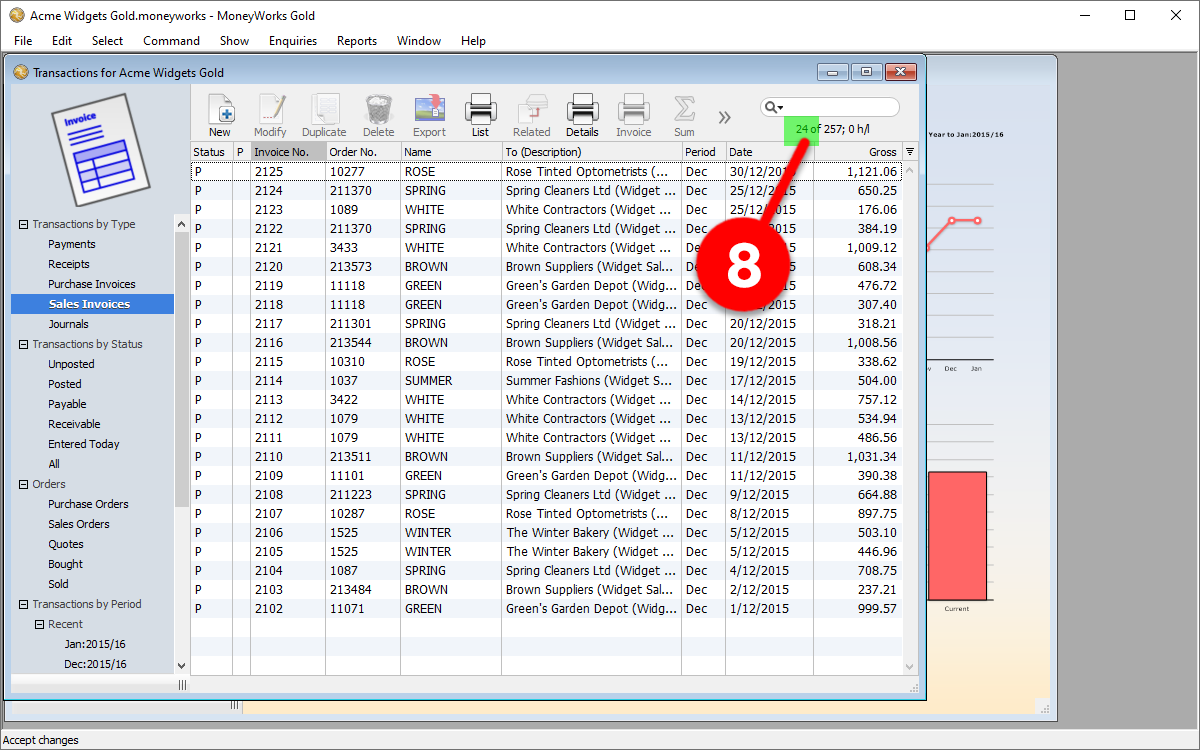
You need to repeat this process for each historical month, so for the month-prior, in the search window, click on the magnifying glass (9) again, and then select the Find by Formula… option again also (10)
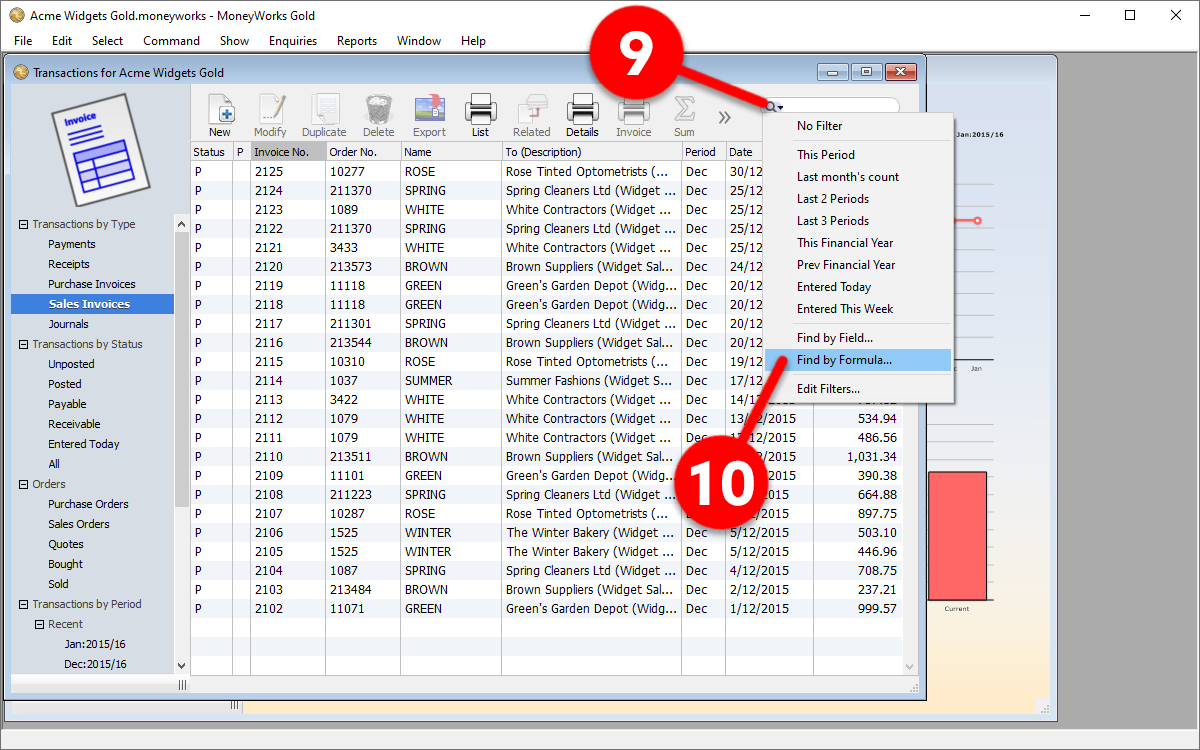
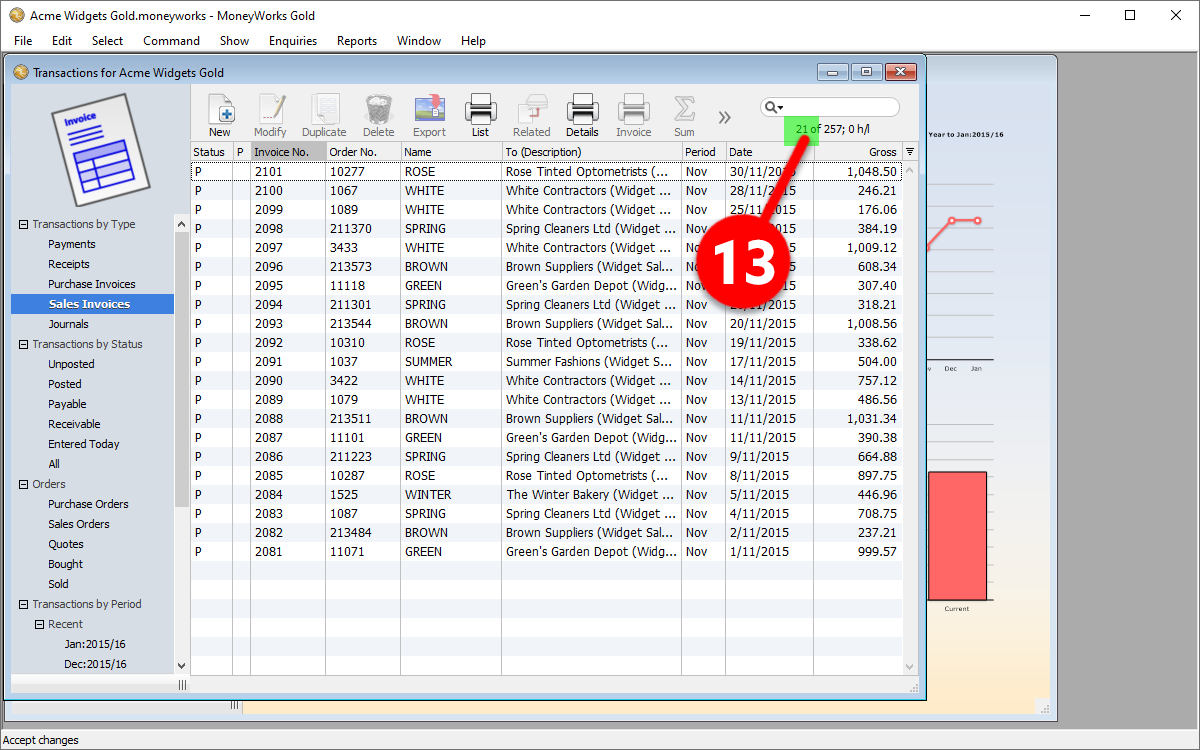
This time, change the “-1” in the calculation to “-2” to specify the previous month (11) and click Find (12) once done.
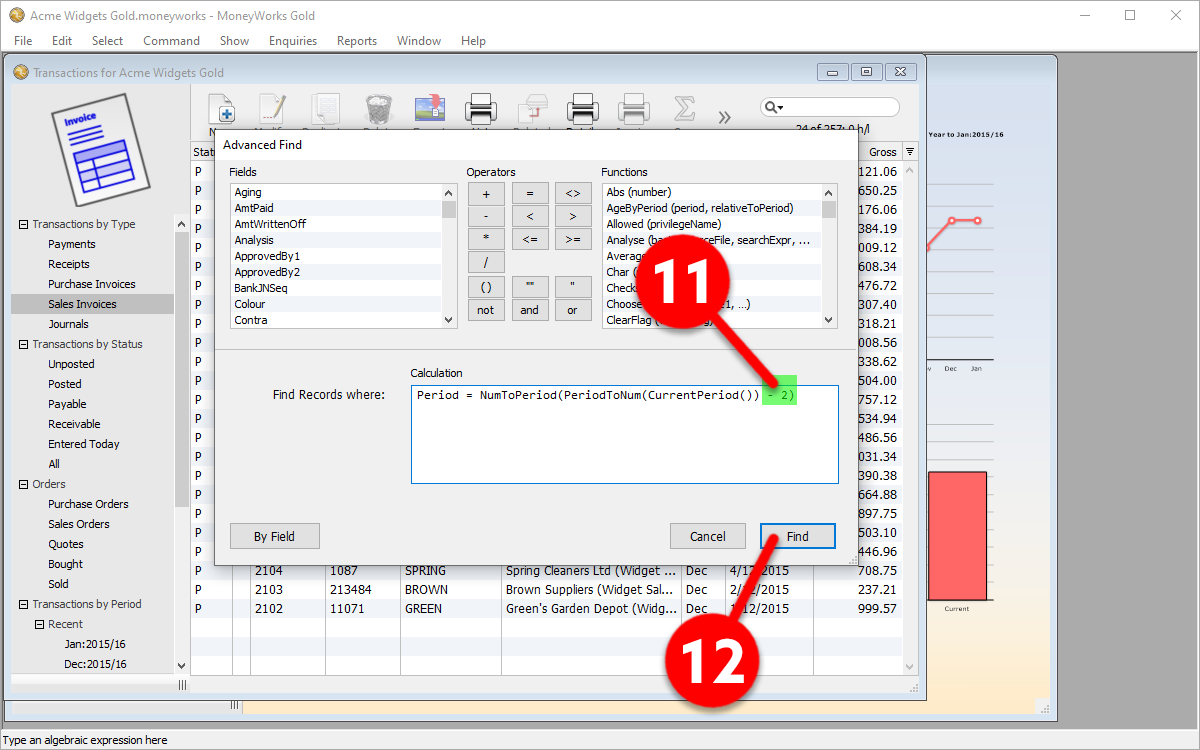
The invoice count will once again be displayed below the search window (13) – in this case, “21 invoices” – please repeat this process for as many historical months as required
Why we ask for historical data
Just in case you’re curious about “Why do you guys ask for our historical data?”, please watch this short 1-minute video:

